GeoJSON is one of the most widely used formats for sharing geographic data on the web. It's open, human-readable, and supported by virtually every GIS tool and data provider on the planet. With GeoBlazor's GeoJSONLayer, you can pull that data directly into your Blazor map with just a URL, style it, add popups, and respond to user interaction, all without writing a single line of JavaScript.
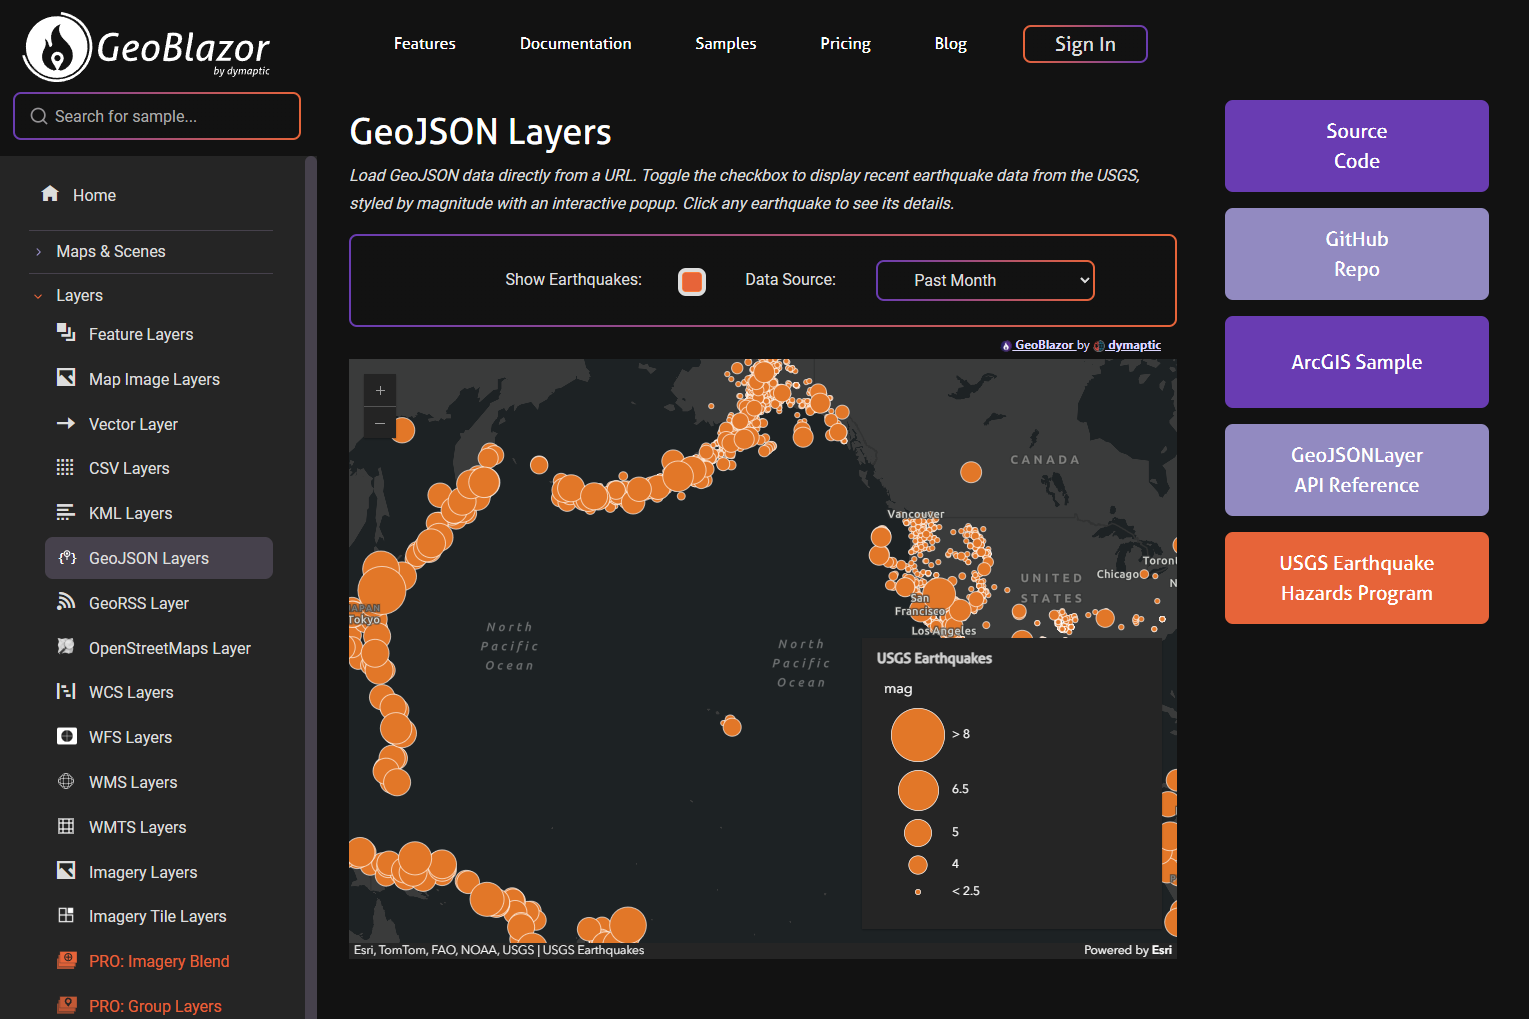
In this post, we'll walk through our new GeoJSON Layers sample, which loads live earthquake data from the USGS, styles points by magnitude using a size variable, and surfaces an interactive popup on click. It's a compact but feature-rich example that shows just how much you can accomplish with GeoBlazor's declarative Razor syntax.
What Is GeoJSON?
GeoJSON is an open standard (RFC 7946) for encoding geographic data structures in JSON. A GeoJSON document contains one or more Features, each with a geometry (point, line, polygon, etc.) and a properties object holding any attributes you care about. Because it's just JSON, it's trivially served from any web server or API endpoint, including the USGS's public earthquake feeds, which we'll use here.
How Do You Set Up a GeoBlazor Map with GeoJSONLayer?
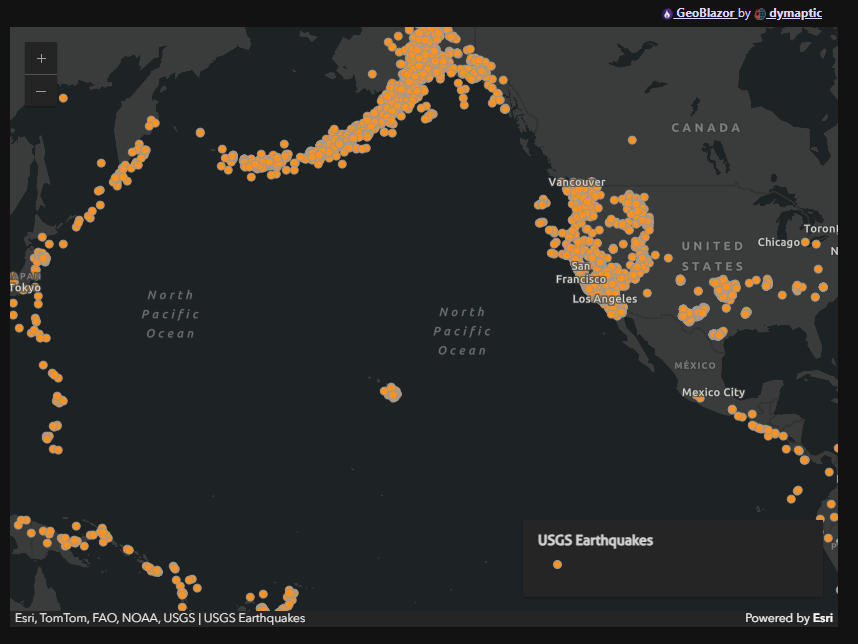
The outer shell of the sample is a standard GeoBlazor MapView with a dark-gray basemap. The dark color makes the orange earthquake markers pop against the background.
<MapView Longitude="-150" Latitude="30" Zoom="2" Class="map-view">
    <Map>
        <Basemap>
            <BasemapStyle Name="BasemapStyleName.ArcgisDarkGray" />
        </Basemap>
            <GeoJSONLayer @key="_dataUrl"
                Url="@_dataUrl"
                Title="USGS Earthquakes"
                Copyright="USGS Earthquakes"
                OrderBy="@([new OrderByInfo("mag", SortOrder.Descending)])">
                ...
            </GeoJSONLayer>
    </Map>
    <LegendWidget Position="OverlayPosition.BottomRight" />
</MapView>
A few things worth noting here right away:
@key="_dataUrl": This tells Blazor to treat theGeoJSONLayeras a new component instance whenever the data URL changes. Without@key, Blazor might try to update the existing component in place, which can leave the old data on screen. Setting@keyto the URL is an idiomatic pattern for forcing a clean reload.OrderBy: TheOrderByInfoarray controls the draw order of features. Sorting bymagdescending means smaller earthquakes are drawn on top of larger ones (since the larger ones are drawn first), which prevents massive blobs from obscuring nearby smaller events.LegendWidget: Dropped in at the bottom right with a single line. It automatically picks up the renderer defined on the layer. No configuration required.
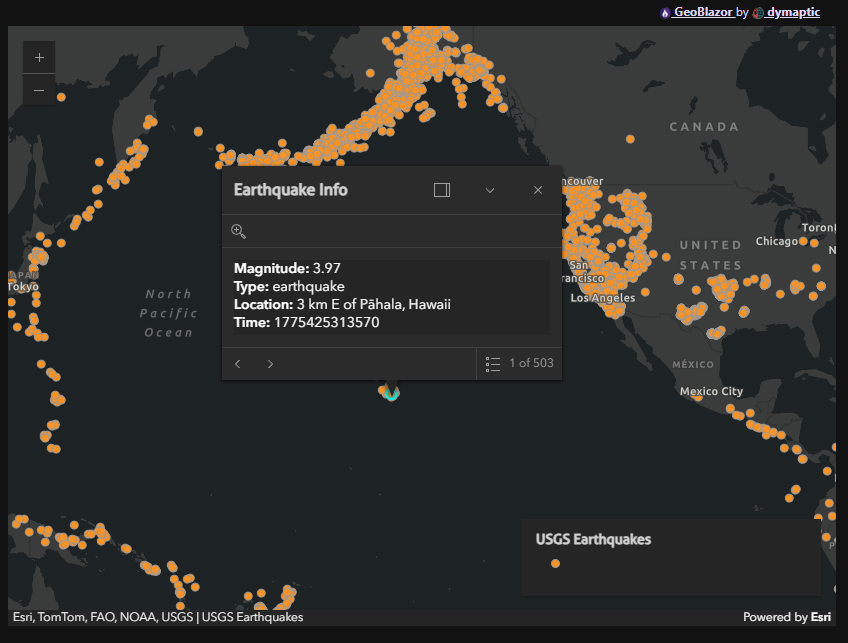
How Do You Add Popups to a GeoJSONLayer?
Popups are a one-liner thanks to PopupTemplate:
<PopupTemplate Title="Earthquake Info"
    StringContent="<b>Magnitude:</b> {mag}<br><b>Type:</b> {type}<br><b>Location:</b> {place}<br><b>Time:</b> {time}" />
<PopupTemplate Title="Earthquake Info"
    StringContent="<b>Magnitude:</b> {mag}<br><b>Type:</b> {type}<br><b>Location:</b> {place}<br><b>Time:</b> {time}" />
The {field} syntax in StringContent binds directly to the GeoJSON feature's properties keys. No code-mapping required. Click any earthquake point on the map and you'll see the magnitude, event type, location string, and timestamp, all pulled straight from the USGS feed.
How Do You Style GeoJSON Points by Magnitude?
Of course, all the earthquake data points currently look the same. Instead of defaulting to a static style, if we use a SimpleRenderer with a SizeVariable to scale each earthquake point proportionally to its magnitude:
<SimpleRenderer>
    <SimpleMarkerSymbol Color="@(new MapColor(226, 119, 40))"
        Size="6"
        Style="SimpleMarkerSymbolStyle.Circle">
        <Outline Color="@(new MapColor(255, 255, 255))" Width="0.5" />
    </SimpleMarkerSymbol>
    <SizeVariable Field="mag"
        MinDataValue="2.5"
        MaxDataValue="8"
        MinSize="4"
        MaxSize="40" />
</SimpleRenderer>
The SimpleMarkerSymbol defines the base appearance: a warm orange circle with a thin white outline. The SizeVariable then takes over for the actual size: a magnitude 2.5 event renders at 4 pixels, while an 8.0 megaquake blows out to 40. Everything in between scales linearly. This is exactly how you'd configure a proportional symbol renderer in ArcGIS Pro or ArcGIS Online, except here you're doing it in C# Razor markup instead of a GUI.
How Do You Switch Between GeoJSON Feeds at Runtime?
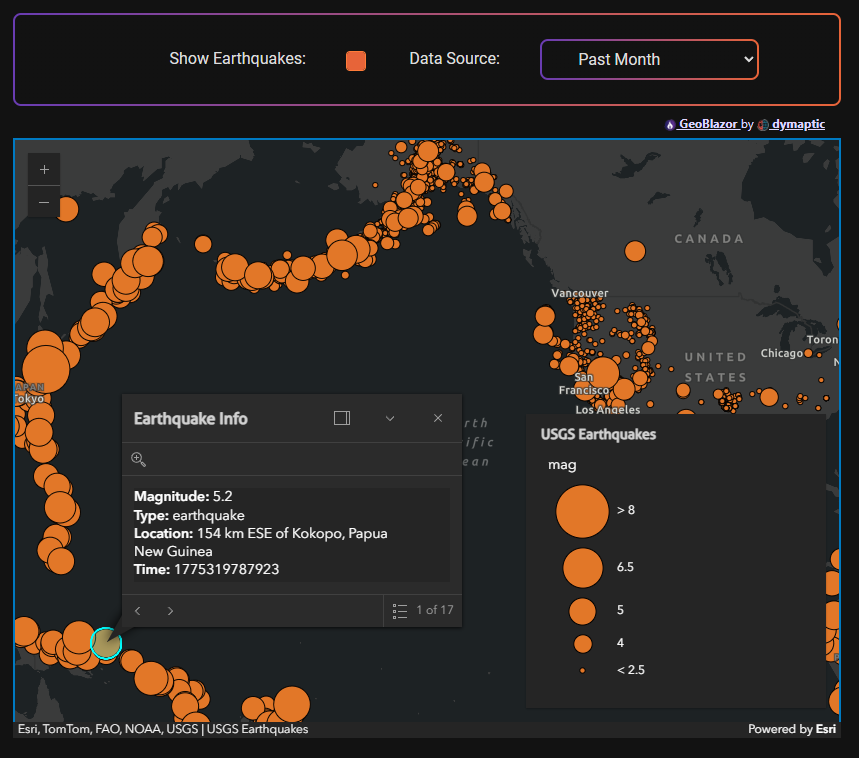
One of the more useful features of the sample is the ability to switch between USGS feeds covering different time windows: past month, past week, or past day. The UI is a simple <select>:
<select id="earthquakes-source" @onchange="OnSourceChanged">
    <option value="month">Past Month</option>
    <option value="week">Past Week</option>
    <option value="day">Past Day</option>
</select>
<select id="earthquakes-source" @onchange="OnSourceChanged">
    <option value="month">Past Month</option>
    <option value="week">Past Week</option>
    <option value="day">Past Day</option>
</select>
And the handler in the @code block updates the URL:
private string _dataUrl = "https://earthquake.usgs.gov/earthquakes/feed/v1.0/summary/all_month.geojson";

private void OnSourceChanged(ChangeEventArgs e)
{
    string period = e.Value?.ToString() ?? "month";
    _dataUrl = period switch
    {
        "week" => "https://earthquake.usgs.gov/earthquakes/feed/v1.0/summary/all_week.geojson",
        "day"  => "https://earthquake.usgs.gov/earthquakes/feed/v1.0/summary/all_day.geojson",
        _      => "https://earthquake.usgs.gov/earthquakes/feed/v1.0/summary/all_month.geojson"
    };
}
Because _dataUrl is also used as the @key on the GeoJSONLayer, changing it via the dropdown triggers Blazor to dispose the old layer component and mount a fresh one pointing at the new URL. The map updates automatically. No JavaScript interop, no manual layer management calls.
Similarly, the "Show Earthquakes" checkbox is just a boolean toggle:
private bool _showEarthquakes;
private bool _showEarthquakes;
<input type="checkbox" @onchange="@(() => _showEarthquakes = !_showEarthquakes)">
<input type="checkbox" @onchange="@(() => _showEarthquakes = !_showEarthquakes)">
When _showEarthquakes is false, the @if block removes the GeoJSONLayer from the component tree entirely. When it flips to true, GeoBlazor adds the layer back to the map. Clean and idiomatic Blazor.
The Complete Razor File
Here's the full sample for reference:
@page "/geojson-layers"
@inherits SamplePage

<PageTitle>GeoJSON Layers</PageTitle>
<h1>GeoJSON Layers</h1>

<p class="instructions">
    Load GeoJSON data directly from a URL. Toggle the checkbox to display recent earthquake data from the USGS,
    styled by magnitude with an interactive popup. Click any earthquake to see its details.
</p>

<div>
    <div class="form-group">
        <div class="spaced-row">
            <label for="earthquakes-checkbox">Show Earthquakes:</label>
            <input id="earthquakes-checkbox"
                   type="checkbox"
                   class="form-check-input"
                   @onchange="@(() => _showEarthquakes = !_showEarthquakes)">
            <label for="earthquakes-source">Data Source:</label>
            <select id="earthquakes-source" @onchange="OnSourceChanged">
                <option value="month">Past Month</option>
                <option value="week">Past Week</option>
                <option value="day">Past Day</option>
            </select>
        </div>
    </div>
</div>

<MapView Longitude="-150" Latitude="30" Zoom="2" Class="map-view">
    <Map>
        <Basemap>
            <BasemapStyle Name="BasemapStyleName.ArcgisDarkGray" />
        </Basemap>
        @if (_showEarthquakes)
        {
            <GeoJSONLayer @key="_dataUrl"
                Url="@_dataUrl"
                Title="USGS Earthquakes"
                Copyright="USGS Earthquakes"
                OrderBy="@(new[] { new OrderByInfo("mag", SortOrder.Descending) })">
                <PopupTemplate Title="Earthquake Info"
                    StringContent="<b>Magnitude:</b> {mag}<br><b>Type:</b> {type}<br><b>Location:</b> {place}<br><b>Time:</b> {time}" />
                <SimpleRenderer>
                    <SimpleMarkerSymbol Color="@(new MapColor(226, 119, 40))"
                        Size="6"
                        Style="SimpleMarkerSymbolStyle.Circle">
                        <Outline Color="@(new MapColor(255, 255, 255))" Width="0.5" />
                    </SimpleMarkerSymbol>
                    <SizeVariable Field="mag"
                        MinDataValue="2.5"
                        MaxDataValue="8"
                        MinSize="4"
                        MaxSize="40" />
                </SimpleRenderer>
            </GeoJSONLayer>
        }
    </Map>
    <LegendWidget Position="OverlayPosition.BottomRight" />
</MapView>

@code {
    public override List<NavMenu.PageLink> PageLinks =>
    [
        new("https://developers.arcgis.com/javascript/latest/sample-code/layers-geojson/", "ArcGIS Sample"),
        new("https://developers.arcgis.com/javascript/latest/api-reference/esri-layers-GeoJSONLayer.html", "GeoJSONLayer API Reference"),
        new("https://www.usgs.gov/programs/earthquake-hazards/earthquakes", "USGS Earthquake Hazards Program")
    ];

    private bool _showEarthquakes;
    private string _dataUrl = "https://earthquake.usgs.gov/earthquakes/feed/v1.0/summary/all_month.geojson";

    private void OnSourceChanged(ChangeEventArgs e)
    {
        string period = e.Value?.ToString() ?? "month";
        _dataUrl = period switch
        {
            "week" => "https://earthquake.usgs.gov/earthquakes/feed/v1.0/summary/all_week.geojson",
            "day"  => "https://earthquake.usgs.gov/earthquakes/feed/v1.0/summary/all_day.geojson",
            _      => "https://earthquake.usgs.gov/earthquakes/feed/v1.0/summary/all_month.geojson"
        };
    }
}
When Should You Use GeoJSONLayer in GeoBlazor?
GeoJSONLayer is a great fit when:
- Your data is already in GeoJSON format (from an API, a GitHub repo, a static file server, etc.)
- You want live or frequently updated data without building your own service (the USGS feeds update every minute)
- You need quick rendering without setting up an ArcGIS Feature Service
- You're prototyping or building internal tools against an existing data source
If you need editing, versioning, or server-side query capabilities, a FeatureLayer backed by ArcGIS Online or ArcGIS Enterprise is usually the better choice. But for consuming open data from the web, GeoJSONLayer gets you there with the least friction.
Try It Yourself
You can run this sample live at samples.geoblazor.com/geojson-layers, and the full source is available in the GeoBlazor-Samples repository on GitHub.
To use GeoJSONLayer in your own project, install the dymaptic.GeoBlazor.Core NuGet package and add a free registration key from licensing.dymaptic.com. Full setup instructions are in our Getting Started guide.
Frequently Asked Questions
What is the difference between GeoJSONLayer and FeatureLayer in GeoBlazor?
GeoJSONLayer loads GeoJSON data directly from any URL and renders it client-side, making it ideal for open data feeds and prototypes. FeatureLayer is backed by an ArcGIS Online or ArcGIS Enterprise service and supports editing, versioning, and server-side queries. Use GeoJSONLayer when consuming external open data, and FeatureLayer when you control the data layer and need richer capabilities.
Does GeoJSONLayer in GeoBlazor require writing any JavaScript?
No. The entire layer, including styling, popups, renderers, and event handling, is configured through Razor markup and C# code. GeoBlazor handles the underlying ArcGIS JavaScript SDK interop for you.
How does GeoBlazor refresh a GeoJSONLayer when the data URL changes?
Setting @key on the GeoJSONLayer to the data URL tells Blazor to dispose the existing layer and mount a fresh one whenever the URL changes. This avoids stale data and removes the need for manual layer management calls.
Where does the USGS earthquake GeoJSON feed come from?
The sample uses public feeds from earthquake.usgs.gov, which publishes GeoJSON summaries for the past day, week, and month. The feeds update every minute and require no authentication.